Defining our ML Data Strategy through Experiments
Copy Paste Detection & Other ML Experiments
Role: Sole designer on two ML teams (Platform & Curation); in deep collaboration with / gratitude to PM partner Ritvik Vasudevan
Timeline: Jan 2024–May 2025
Users: Abstractors + clinical experts
Contributions: Service blueprint on internal ML development, led lean experiments on patient summaries & ML predictions, conducted usability testing & created designs for copy paste detection, shut down user-facing ML experiments
Outcomes
Over 18 months our team experimented with LLMs to improve the chart abstraction experience and increase efficiency, identifying and performing critical LLM infrastructure work by removing copy-paste text from charts. However, we also learned through failed tests how clinical experts interpret, use, and find value (or don't) from LLM data, enough to confidently pivot and build Patient Chart Extractor in 2025 to high adoption and revenue numbers.
Context: LLM Pivot
In 2024, Flatiron Health began seeing diminishing returns from its proprietary deep learning models as public, generally-trained LLMs started to surpass them. Our Machine Learning team began experimenting with open-ended predictions to regain our edge. On the product side, we wanted to understand how best to use LLMs to find and curate data in clinical workflows. These lean experiments—primarily failures—ultimately defined our strategy for the Patient Chart Extractor (PCE) app.
Abstraction at Flatiron
Clinical data is often buried in stacks of PDF visit notes and billing reports. To structure this data (e.g., drug start/end dates), "abstractors"—oncology-trained experts—manually pull information into forms. This process takes 15–85 minutes per task and costs $29 million annually. We explored whether LLMs could speed up or partially replace this expensive workflow.
Part 1: Patient Summary Experiments (Q1 2024)
What We Tried:
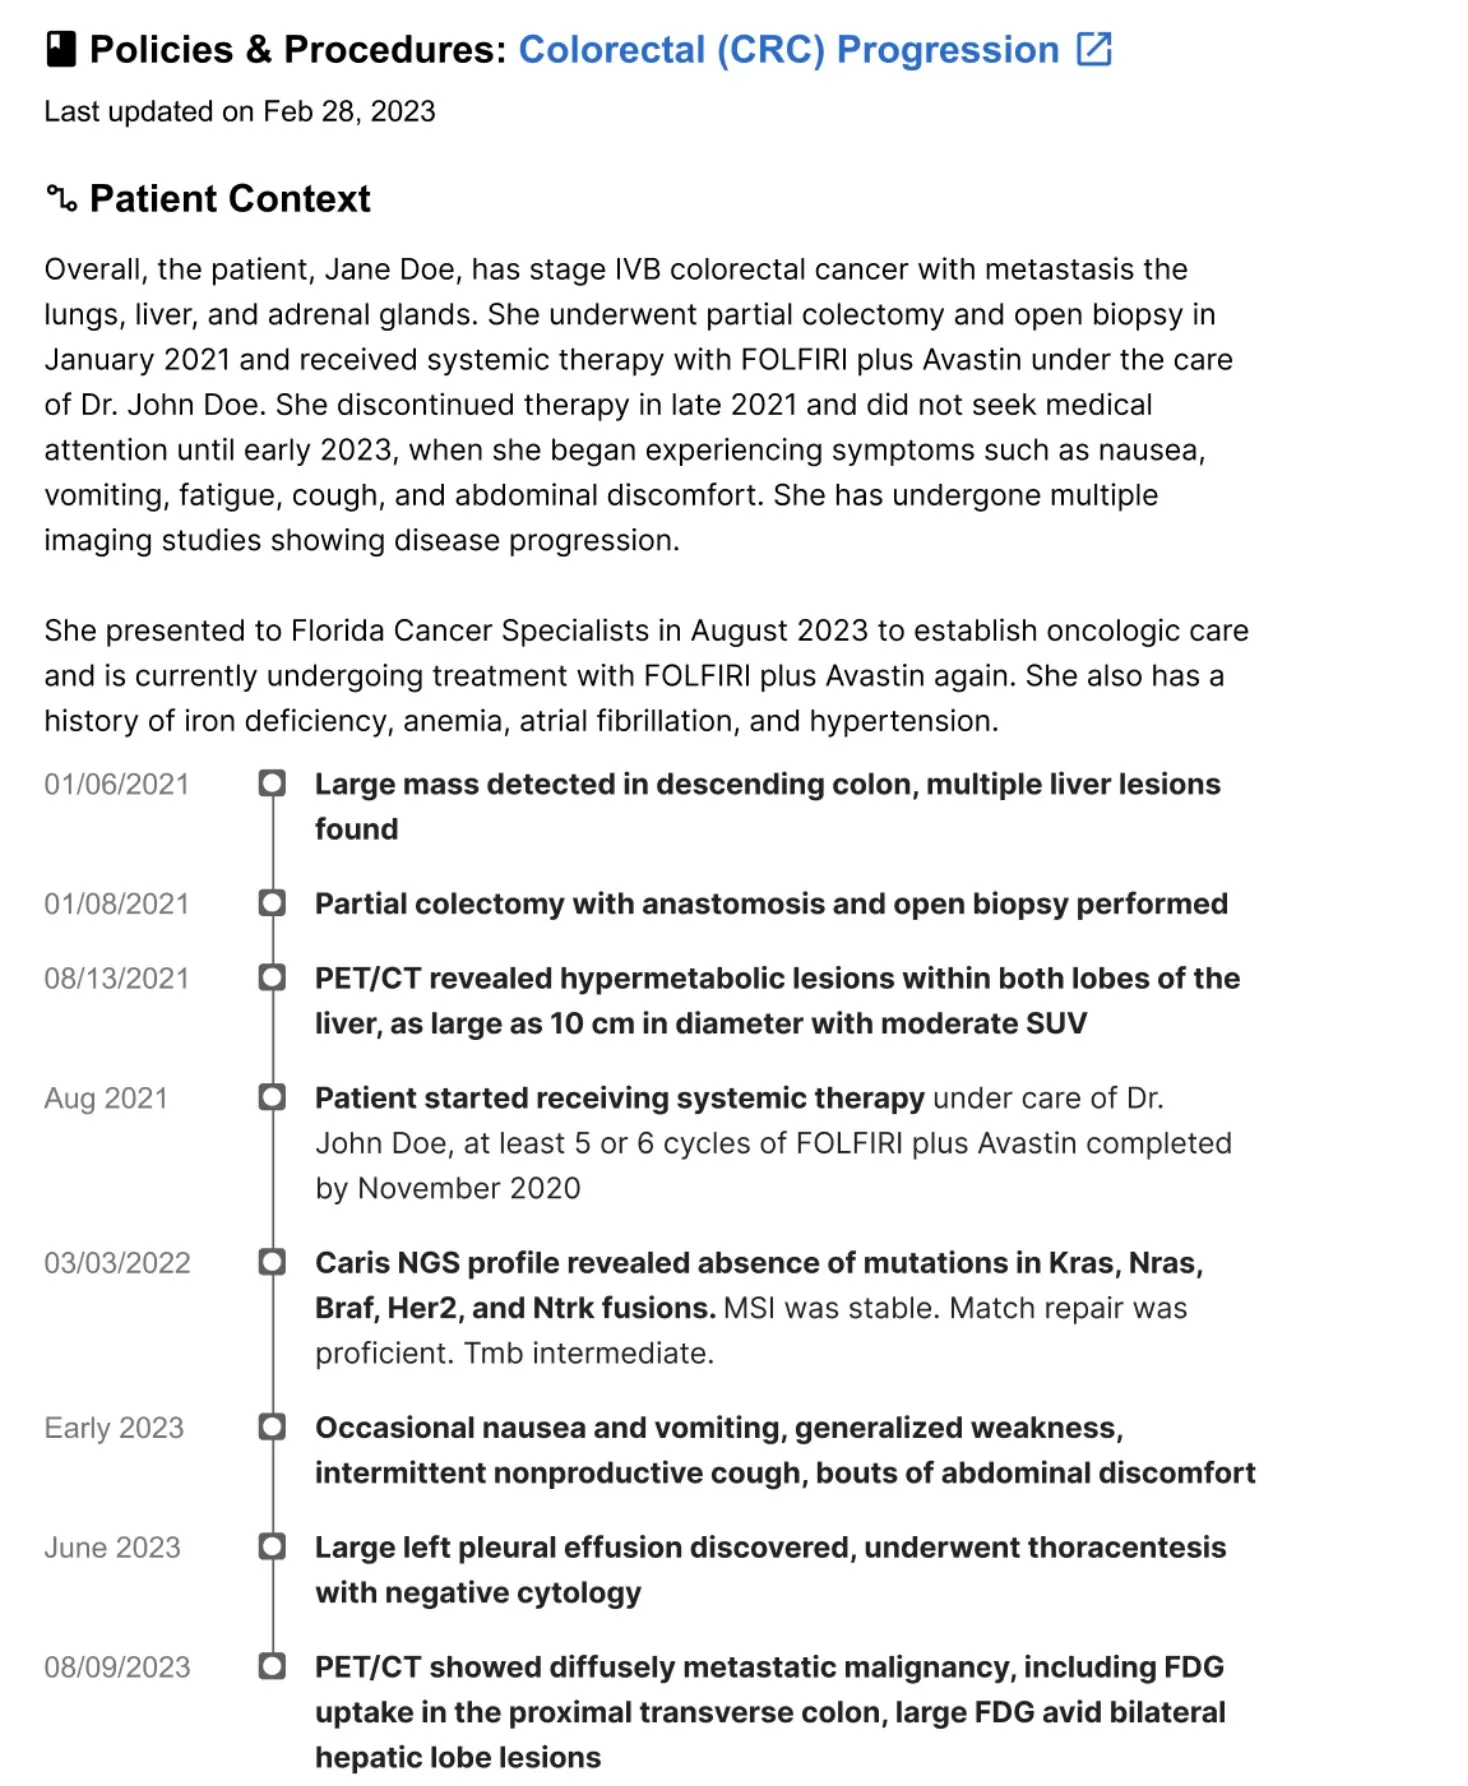
We prototyped universal patient summaries in Patient Manager to give abstractors a high-level journey overview, assuming it would help them locate specific dates faster.
Outcome:
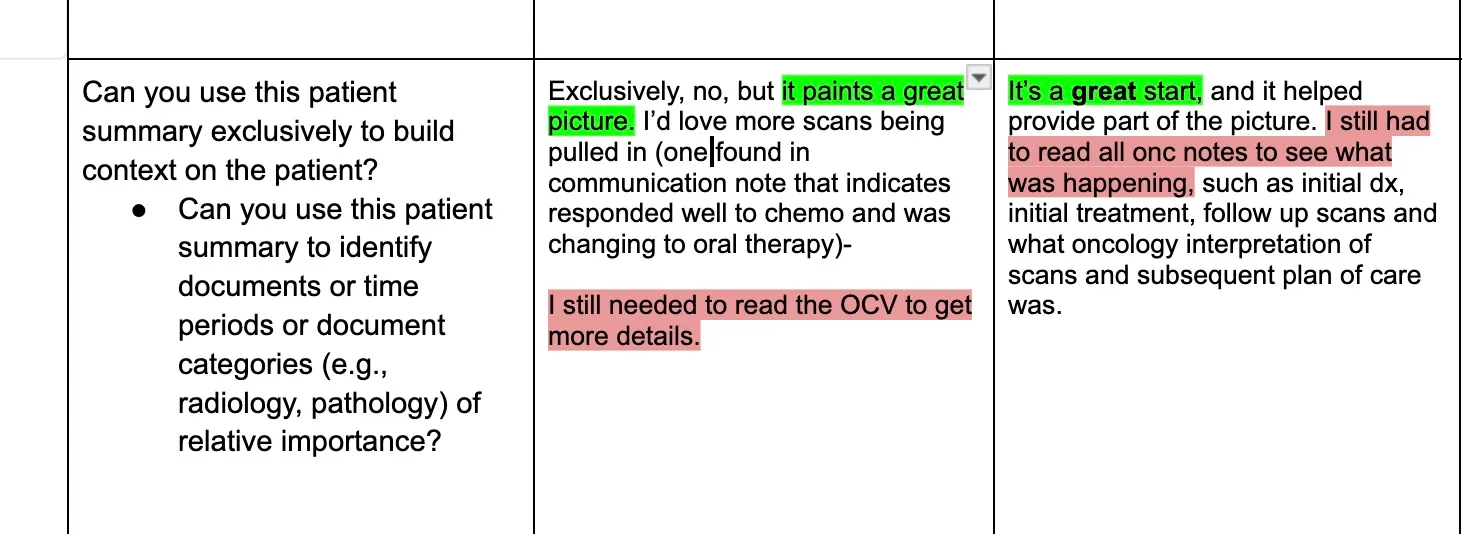
Feedback was enthusiastic, but summaries were too generic and lengthy. Abstractors working on a specific diagnosis don't need a comprehensive hospitalization history; they found the information interesting but not useful for completing specific tasks.
Key Learnings:
Generic summaries fail because clinical work requires extreme specificity. Abstractors need targeted data (e.g., "Is there evidence of biomarker testing?") rather than broad medical biographies. This shift pushed us toward specialized modules over broad summarization.
Technical constraints were also significant. Oncology charts grow by 40–200 documents annually, and 40–50% of the content is copy-pasted. LLMs would often repeat information, report incorrect years, or exceed context windows and miss crucial data. Finally, we learned that user delight is a dangerous metric for LLMs. LLMs hallucinate with confidence; I had to teach the team to observe behavior, as "I can't believe you can make a summary!" means nothing if users re-read every document anyway.
Part 2: Copy Paste Detection (Q3 2024)
What We Tried:
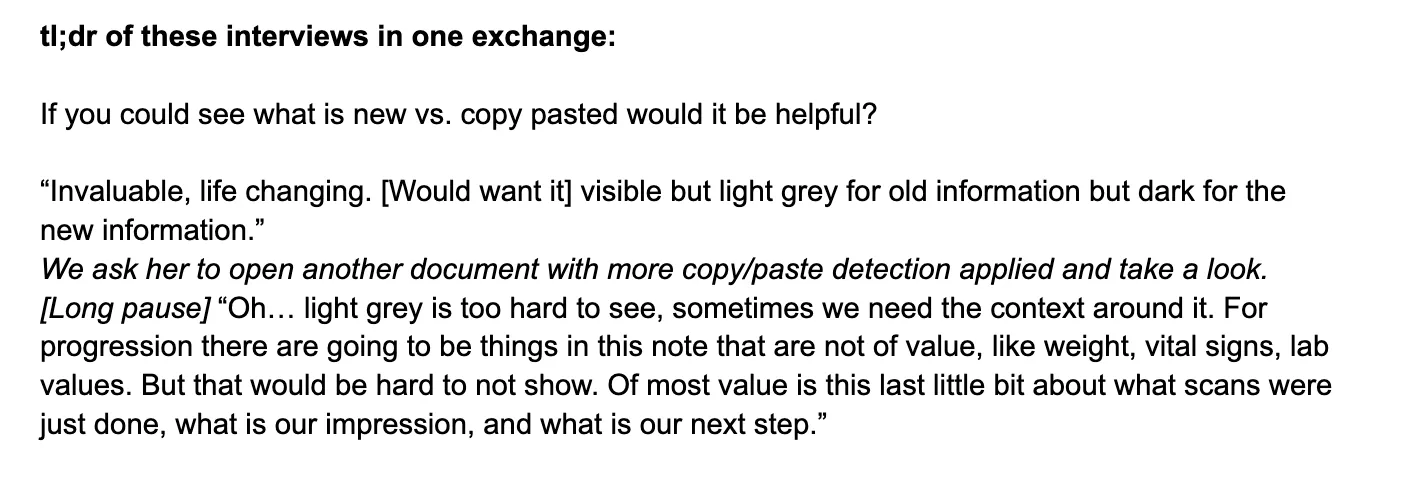
We pivoted to identifying and greying out copy-pasted text to save LLM memory and highlight only net new sentences that didn't exist in previous notes.
Outcome:
Across the fives rounds of testing I conducted, prototypes were a hit; users called the feature "life-changing," and abstractors were 36% faster in live experiments I co-created with Data Science. However, when we released the "git diff-style" implementation, sentiment cratered. Users found the greyed-out text hard to read and were stressed by the missing context. Up to 60% of users disabled the feature, and actual efficiency gains dropped to 15%.
Key Learning:
I realized that injecting radical changes into decade-old workflows creates friction for relatively small gains, that it likely wouldn't be possible to make abstraction an LLM-first workflow. We also decided to decouple LLM experiments from the main Patient Manager tool to explore value for other internal stakeholders.
Part 3: ML-Derived Data Insertion (Q4 2024)
What We Tried:
As one last hail mary, we surfaced ML-predicted biomarker reports or diagnosis dates directly within tasks to give abstractors a "head start." For example: "Patient was diagnosed on dateX and likely first progressed on dateY. If dateY is accurate, continue on to next progression.""
Outcome:
Because predictions lacked context or document references, abstractors had zero trust. They "relitigated the chart," manually verifying earlier diagnosis dates and negating time savings. We pivoted after seeing multiple users immediately return to the beginning of the patient chart, sometimes even earlier than dateX.
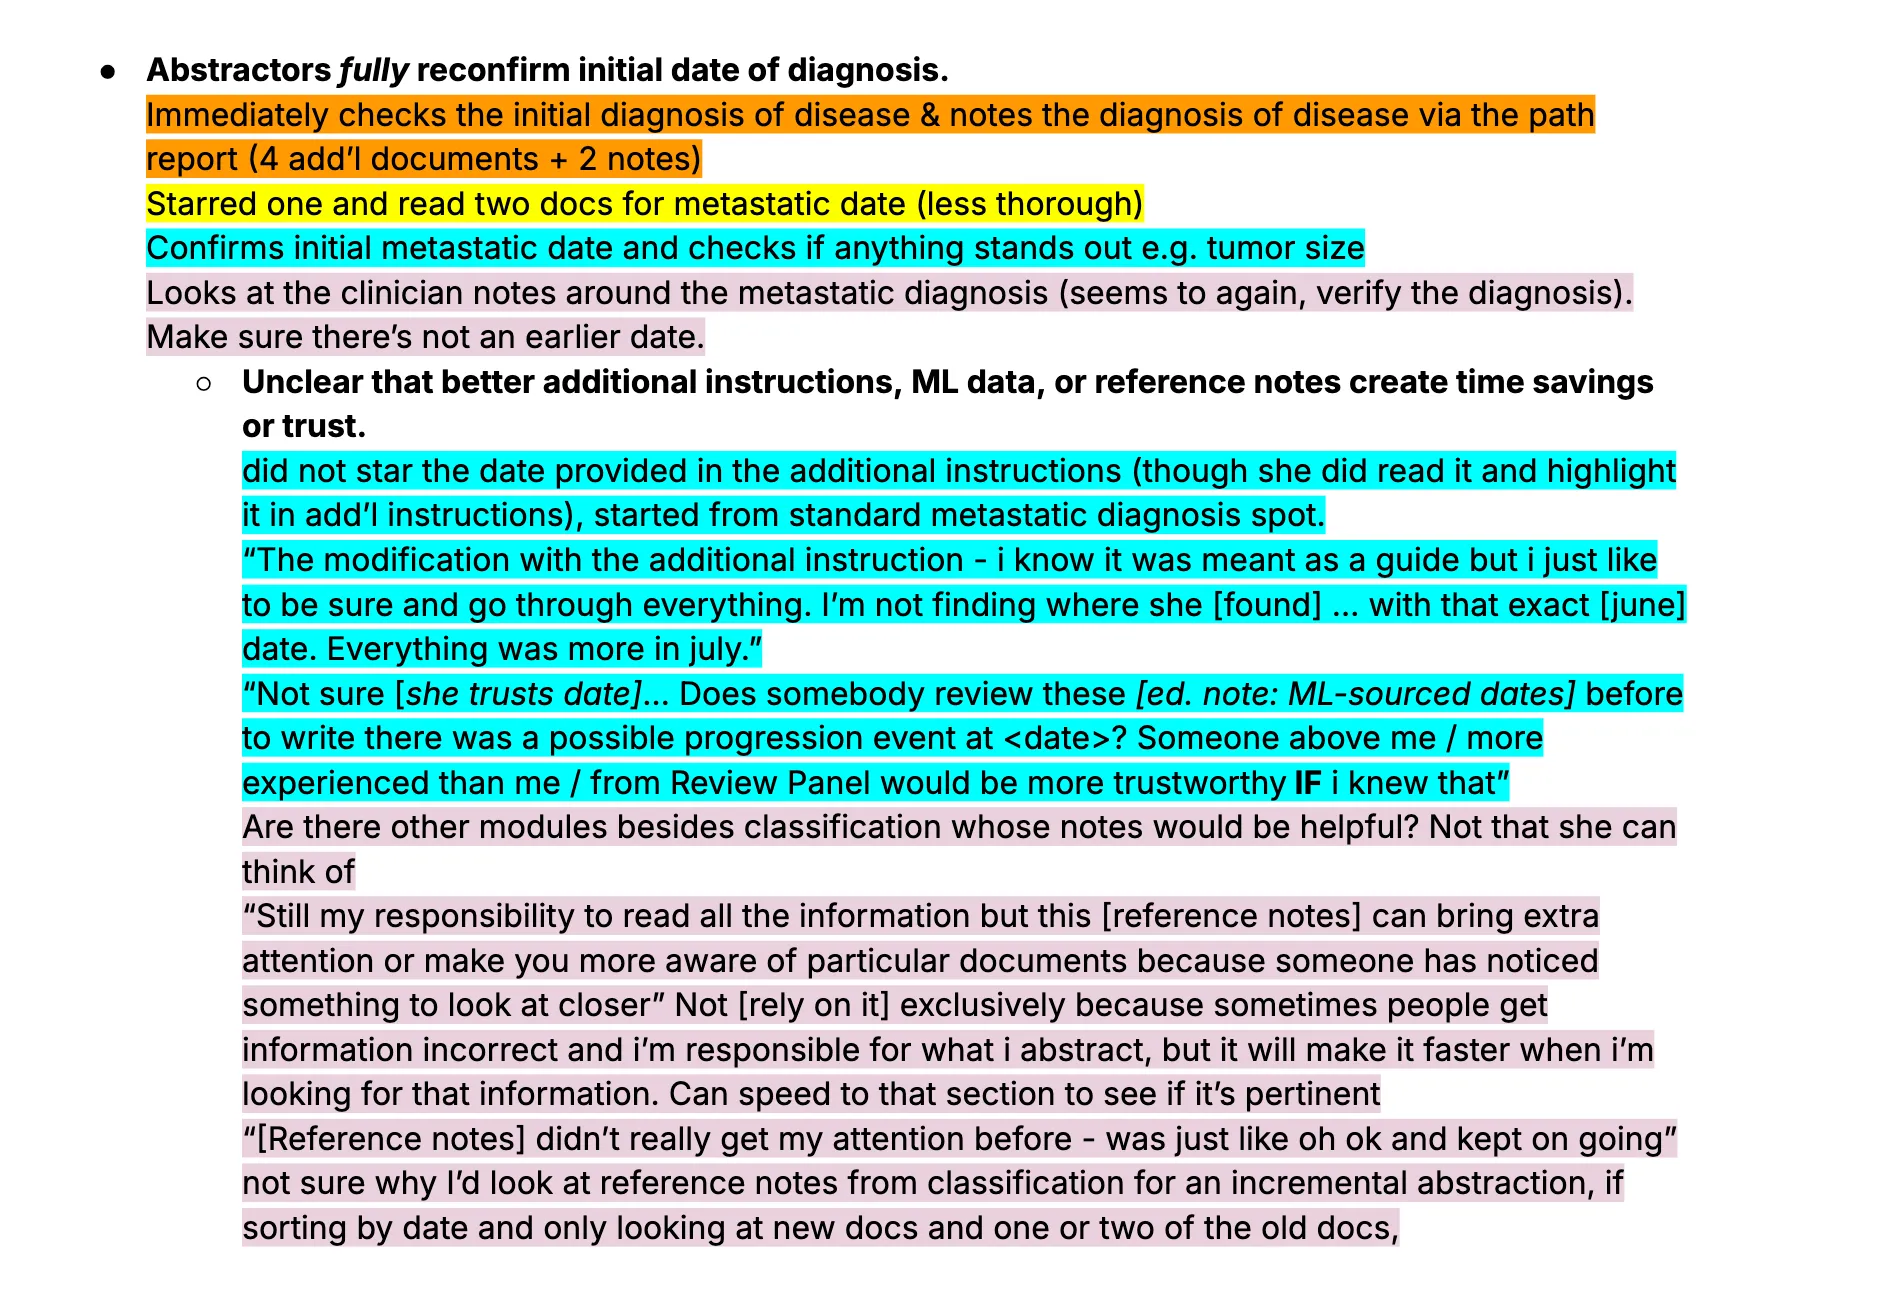
Key Learning:
Users won't trust "black box" data. I realized abstractors were only comfortable with existing data in "incremental" tasks (updating previously abstracted charts). The Patient Manager team would explore how to make data review a concept within the app (a different project altogether) and the ML team pivoted to internal data managers.
Clinical Pivot: Chart Review Service (Q1 2025)
We then engaged Clinical Data (CD) managers, who assess project feasibility. We built a Streamlit chatbot for single-patient queries to test the depth and specificity users required.
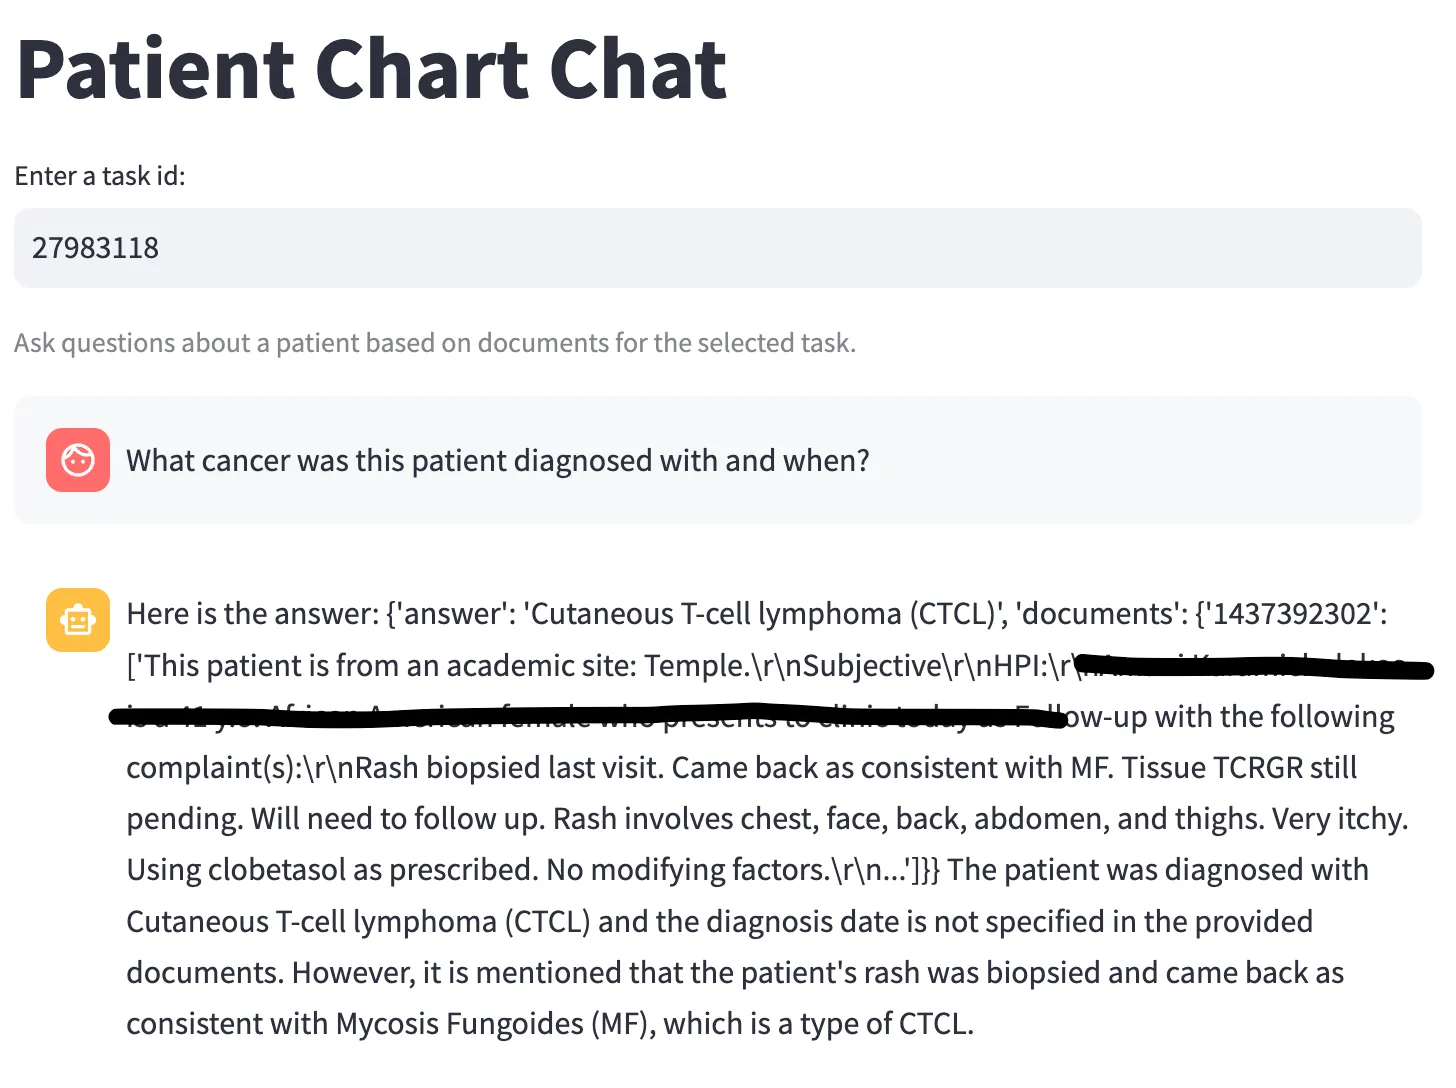
Outcome:
CDs found limited value in querying individuals; they needed cohort-level insights and batch operations. However, they confirmed that being able to verify data presence across a cohort (e.g., "3/50 patients have this trial drug") was highly valuable at scale.
What We Learned:
Our ideal user was actually a semi-clinical expert who could come up with complex questions and benefit from "close enough" results across multiple patients. While abstraction is the gold standard for final data delivery, decent AI insight is better than none for scoping deals, QA, and disease exploration.
Service Blueprint (Q4 2024)
In parallel, I conducted a contextual inquiry into how Machine Learning Engineers (MLEs) develop LLM models at Flatiron.
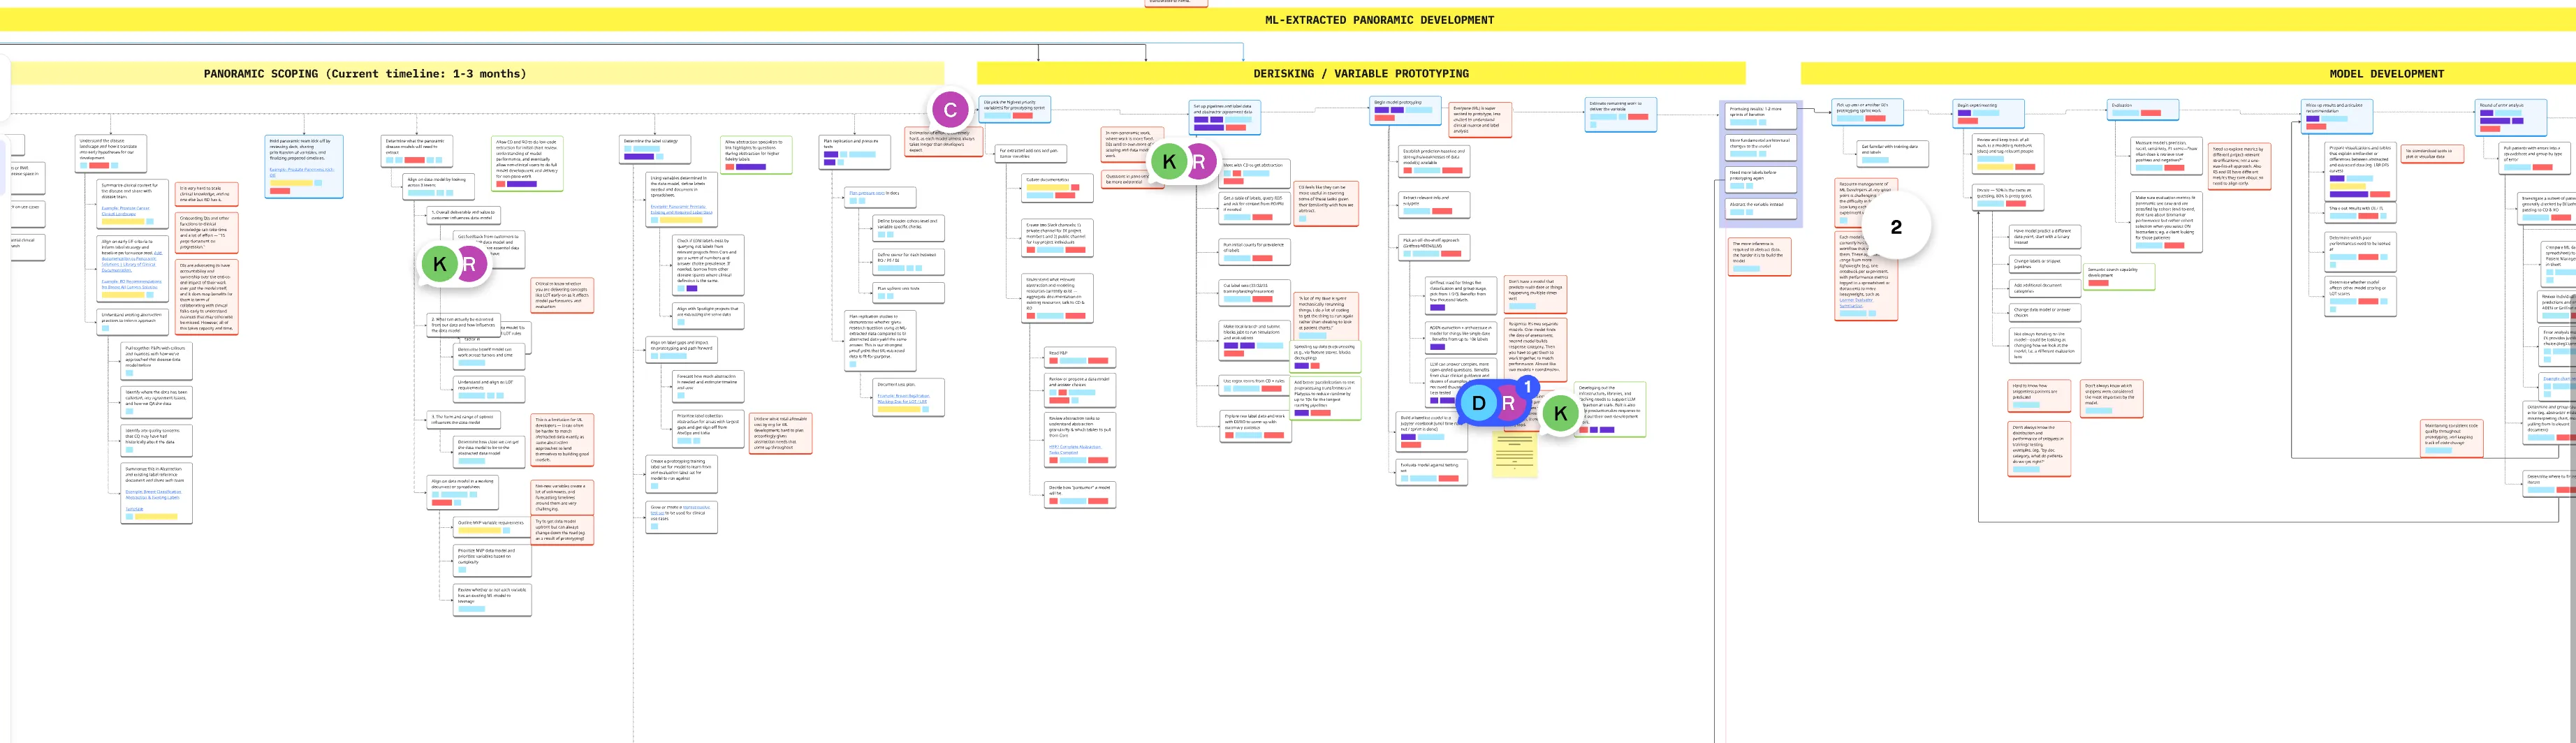
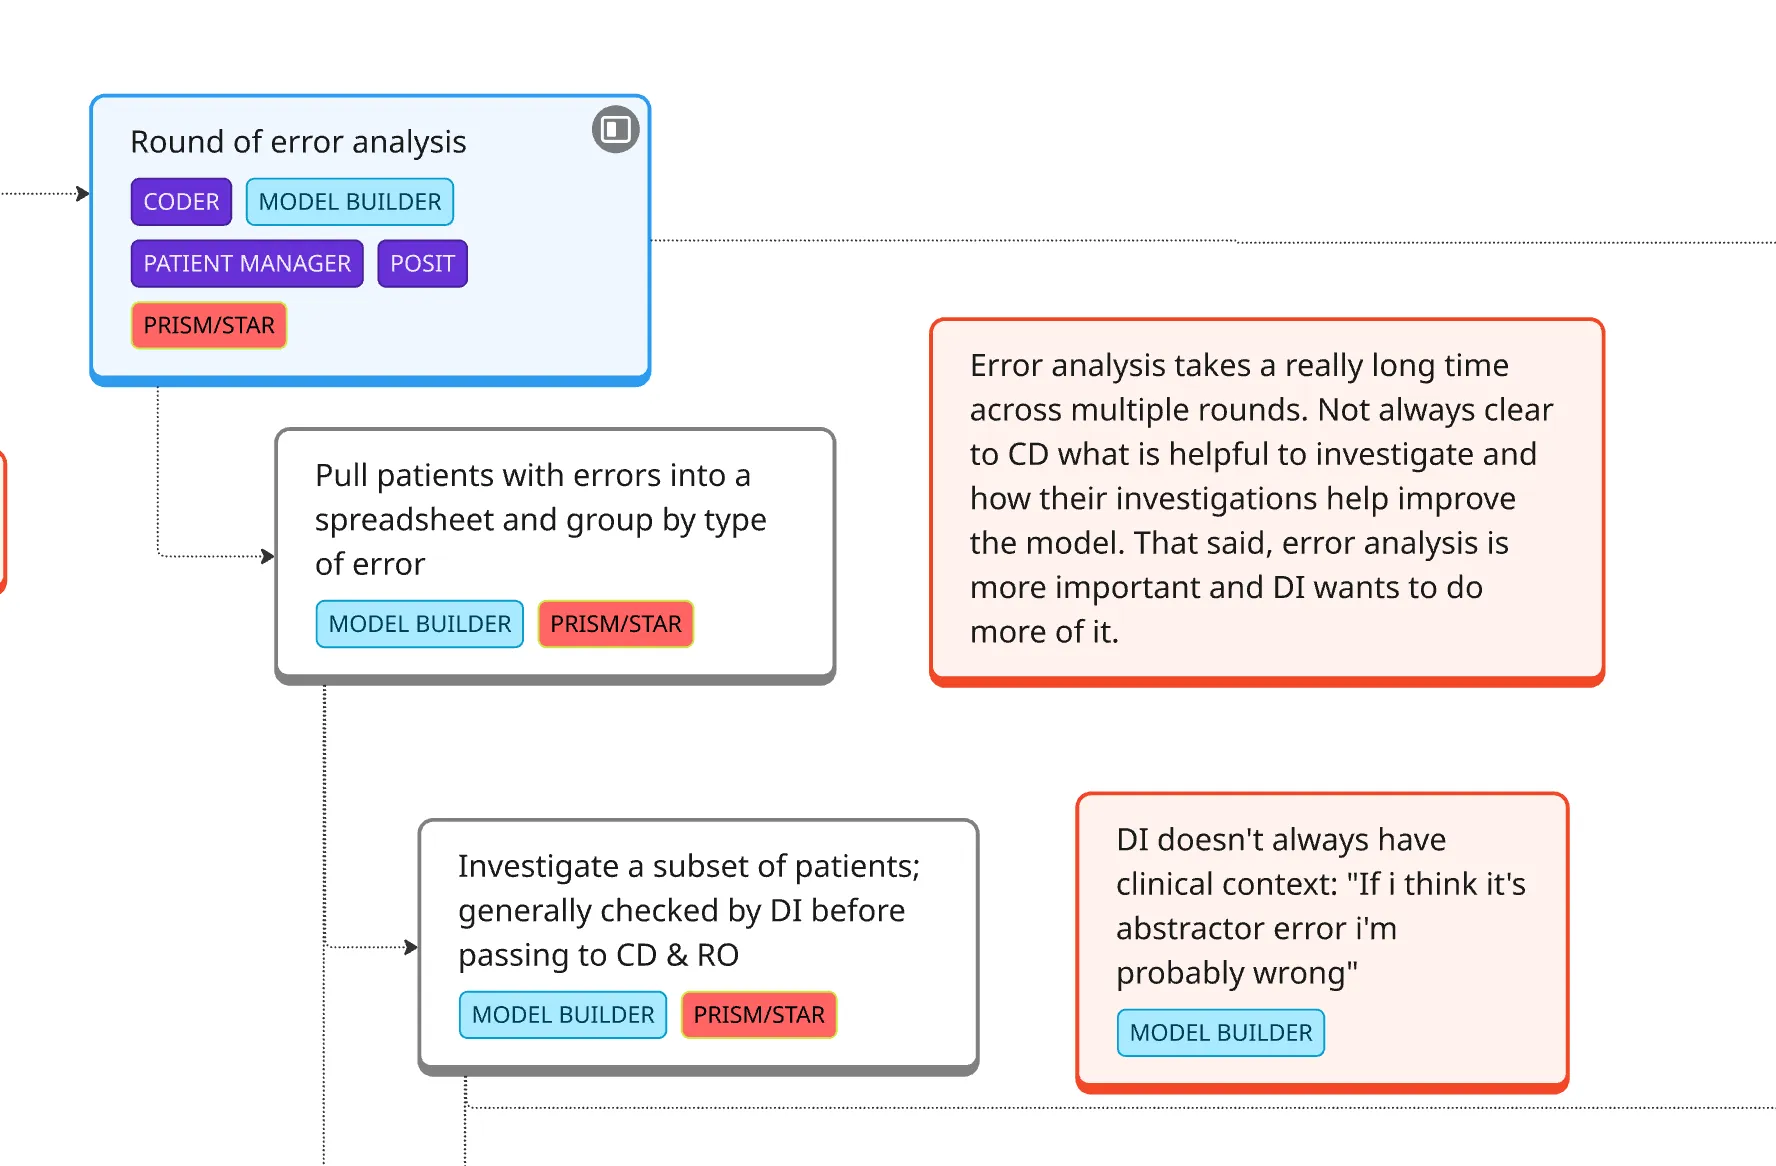
Outcome:
I found and shared (through a service blueprint) that MLEs were spending massive amounts of time on clinical work—finding the right cohort data and learning oncology concepts—often poorly. I realized that if clinical users had direct access to run their own LLMs, they could handle the majority of development themselves.
Learning from Failures & Designing for Scale
We built a low-fidelity version of Patient Chart Extractor (PCE) for batch queries. Through this year of testing, we established these core principles:
- Scale over depth: The larger the cohort, the more valuable the insight; invest in infrastructure that approximates real dataset size.
- Single focus: Users need to know that the data is LLM-generated, and have the time, energy, and space to think through the output, rather than being forced to trust and rely on it in another process.
- Transparency: Every result needs to include the LLM’s logic and direct references to source documents to build trust. Show users early and often what reasoning and output looks like so they can see the model's strengths and weaknesses.
- Accessibility: Make PCE as useful as possible to anyone at Flatiron with some clinical knowledge. Make it easy to learn from other projects and build LLM competencies over time.
PCE is now active across multiple teams. By learning through failure, we built a tool that has generated over $3.2M in new project earnings and created a solid foundation for LLM integration at Flatiron. We are in conversations to bring more technical workflows into PCE and start democratizing what was previously MLE work only.
← Back to work